

In this next installment of our ‘Keys to Successful Flow Measurement' series, we will review the most common way in which a user can output their measured flow data from 400-Series Research Flowmeters and also address a few tips & tricks related to proper system integration and use.
Our 400-series flowmeters are used in various research fields including life science, medical device testing, durability testing, and many more. Although users can visualize average flow data on the meter itself, the vast majority of Transonic flow equipment users are interested in instantaneous pulsatile flow and for that, some combination of Data Acquisition System (DAQ) hardware and software is required. The DAQ hardware acts as an interface between the 400-Series flowmeter’s output(s) and a PC, receiving the analog output flow measurement and converting it into a digital data stream in scaled units (mL/min or L/min) for analysis within software on the PC. With multiple inputs on a typical DAQ system, this allows for the synching and recording of data from multiple flow sensors or other relevant measurements such as pressure, Pressure-Volume Loops, ECG, etc. into a single data file.
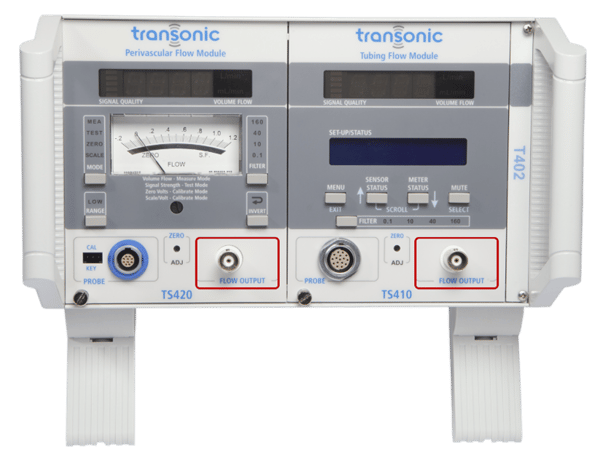
Figure 1. 400-Series Dual-Channel Flowmeter with TS420 Module (Left) and TS410 Module (Right). Analog BNC Outputs Highlighted in Red.
As seen in the image above, both the TS410 tubing flowmeter and the TS420 perivascular flowmeter have a ‘Flow Output’ connection located on the front (highlighted in red). This is the most common method for connecting to the DAQ, which utilizes a standard BNC cable and provides the instantaneous pulsatile volume flow output. Users looking for more data output options will find a terminal block on the back of the module, which includes pulsatile flow, mean flow and other specialized functions – please see the user manual for complete details (request a copy below).
Now that we have established the benefit of working with a DAQ and how to output the flowmeter analog signal for recording, we must set up the DAQ and software to accept the analog signal and convert it to a scaled unit of volume flow. This process is typically referred to as a ‘2-point calibration’ and can be a common source of user questions. The good news is that once this 2-point calibration is done and saved within the recording software, it does not need to be done again for the same sensor size/calibration setting.
Please see the 400-series User Manual and consult your data acquisition provider instructions for complete details on the 2-point calibration. In brief, with the systems connected and turned on, a reference signal of 0V is sent from the flowmeter to the DAQ, followed by a 1V reference signal. Within the data acquisition software settings, the user will then select and assign the appropriate volume conversion values to the 0V and 1V reference signals. 0 volts will always equal 0 ml/min or L/min flow while the 1V reference signal will be a measure in mL/min or L/min and depends on both the flowsensor size and programmed calibration (more on this below). With this new scale set and saved, and with the flowmeter in “measure mode”, a linear conversion will be applied to the full +/-5V flowmeter output range, resulting is accurate pulsatile flow data visualization on a computer for further processing.
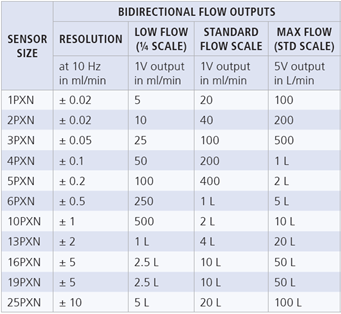
Figure 2. 1V scale Factor for PXN Inline Flowsensors in Low Flow and Standard Flow.
As mentioned, a 2-point calibration only needs to be done once for a given sensor size and calibration setting. There are, however, scenarios to be mindful of where the 1V scale factor can change for a given sensor size. Using the 5PXN inline flowsensor as an example, we factory calibrate this tubing sensor for up to four unique use conditions, comprised of fluid type, temperature, and flow range. To provide flexibility for users, we offer two unique linear flow ranges for each sensor size . For our example 5PXN sensor, these flow ranges are 100-500mL/min in low flow scale and 0.2-2L/min in standard flow. With each unique flow range, there is a corresponding 1V scale factor that varies when performing your 2-point calibration depending on which calibration you have; 100mL/min and 400mL/min, respectively. See Figure 2 above for a reference list of PXN inline flowsensor 1V scale factors. A full explanation of flow scaling and calibration will be the topic of a future blog.
To wrap-up this overview of flow data output from the 400-Series Flowmeters, there is an important related feature/option for users to be aware of, and that is the filter settings for the analog output. Both the TS410 Tubing Flow Module and TS420 Perivascular Flowmeter Module have 4 low pass filter setting options: 0.1Hz, 10Hz, 40Hz, and 160Hz. The appropriate filter setting is dependent upon resolution required to detect changes in the collected data. Regardless of the module (TS410 or TS420) or application, we have recommended filter settings required to fully resolve waveforms at different pulsatile rates.
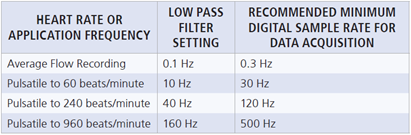
Figure 3: Recommended Low Pass Filter Setting based on Heart Rate or Application Frequency.
The important thing for users to keep in mind is that the selected filter option will be applied to the pulsatile flow data before being output. For example, if the 0.1 Hz filter is selected, only a ‘mean flow’ signal will be output, and the pulsatile nature of the flow waveform would not be captured. In an ideal scenario, the data is filtered/sampled to capture all relevant details of the flow waveform without over-sampling and becoming ‘noisy’.
Please refer to the 400-Series Flowmeter User Manual for complete details on analog outputs, filter settings, and configuring your data acquisition system. Should you have any questions related to Transonic equipment and optimizing your flow measurement in the lab, please contact a member of our Team.